> For the complete documentation index, see [llms.txt](https://docs.groundcover.com/llms.txt). Markdown versions of documentation pages are available by appending `.md` to page URLs; this page is available as [Markdown](https://docs.groundcover.com/collect-data/monitor-data-sources-integrations.md).
# Monitor Data Sources Integrations
## Overview
groundcover supports many types of data sources that could be integrated. Once an integration is live, users can evaluate whether the integration is working as expected.
This page details the various methods that users can apply in order to better understand their integrations status.
## Pull Integrations
In the case of pull integrations, groundcover runs every interval and pulls information from an external data source. The following are examples of pull integrations - AWS CloudWatch, GCP Metrics, Prometheus, Redis Cloud.
All of the pull integrations are defined in the [data sources](https://app.groundcover.com/data-sources) page.
The following information is available for users by clicking on any configuration and opening the drawer:
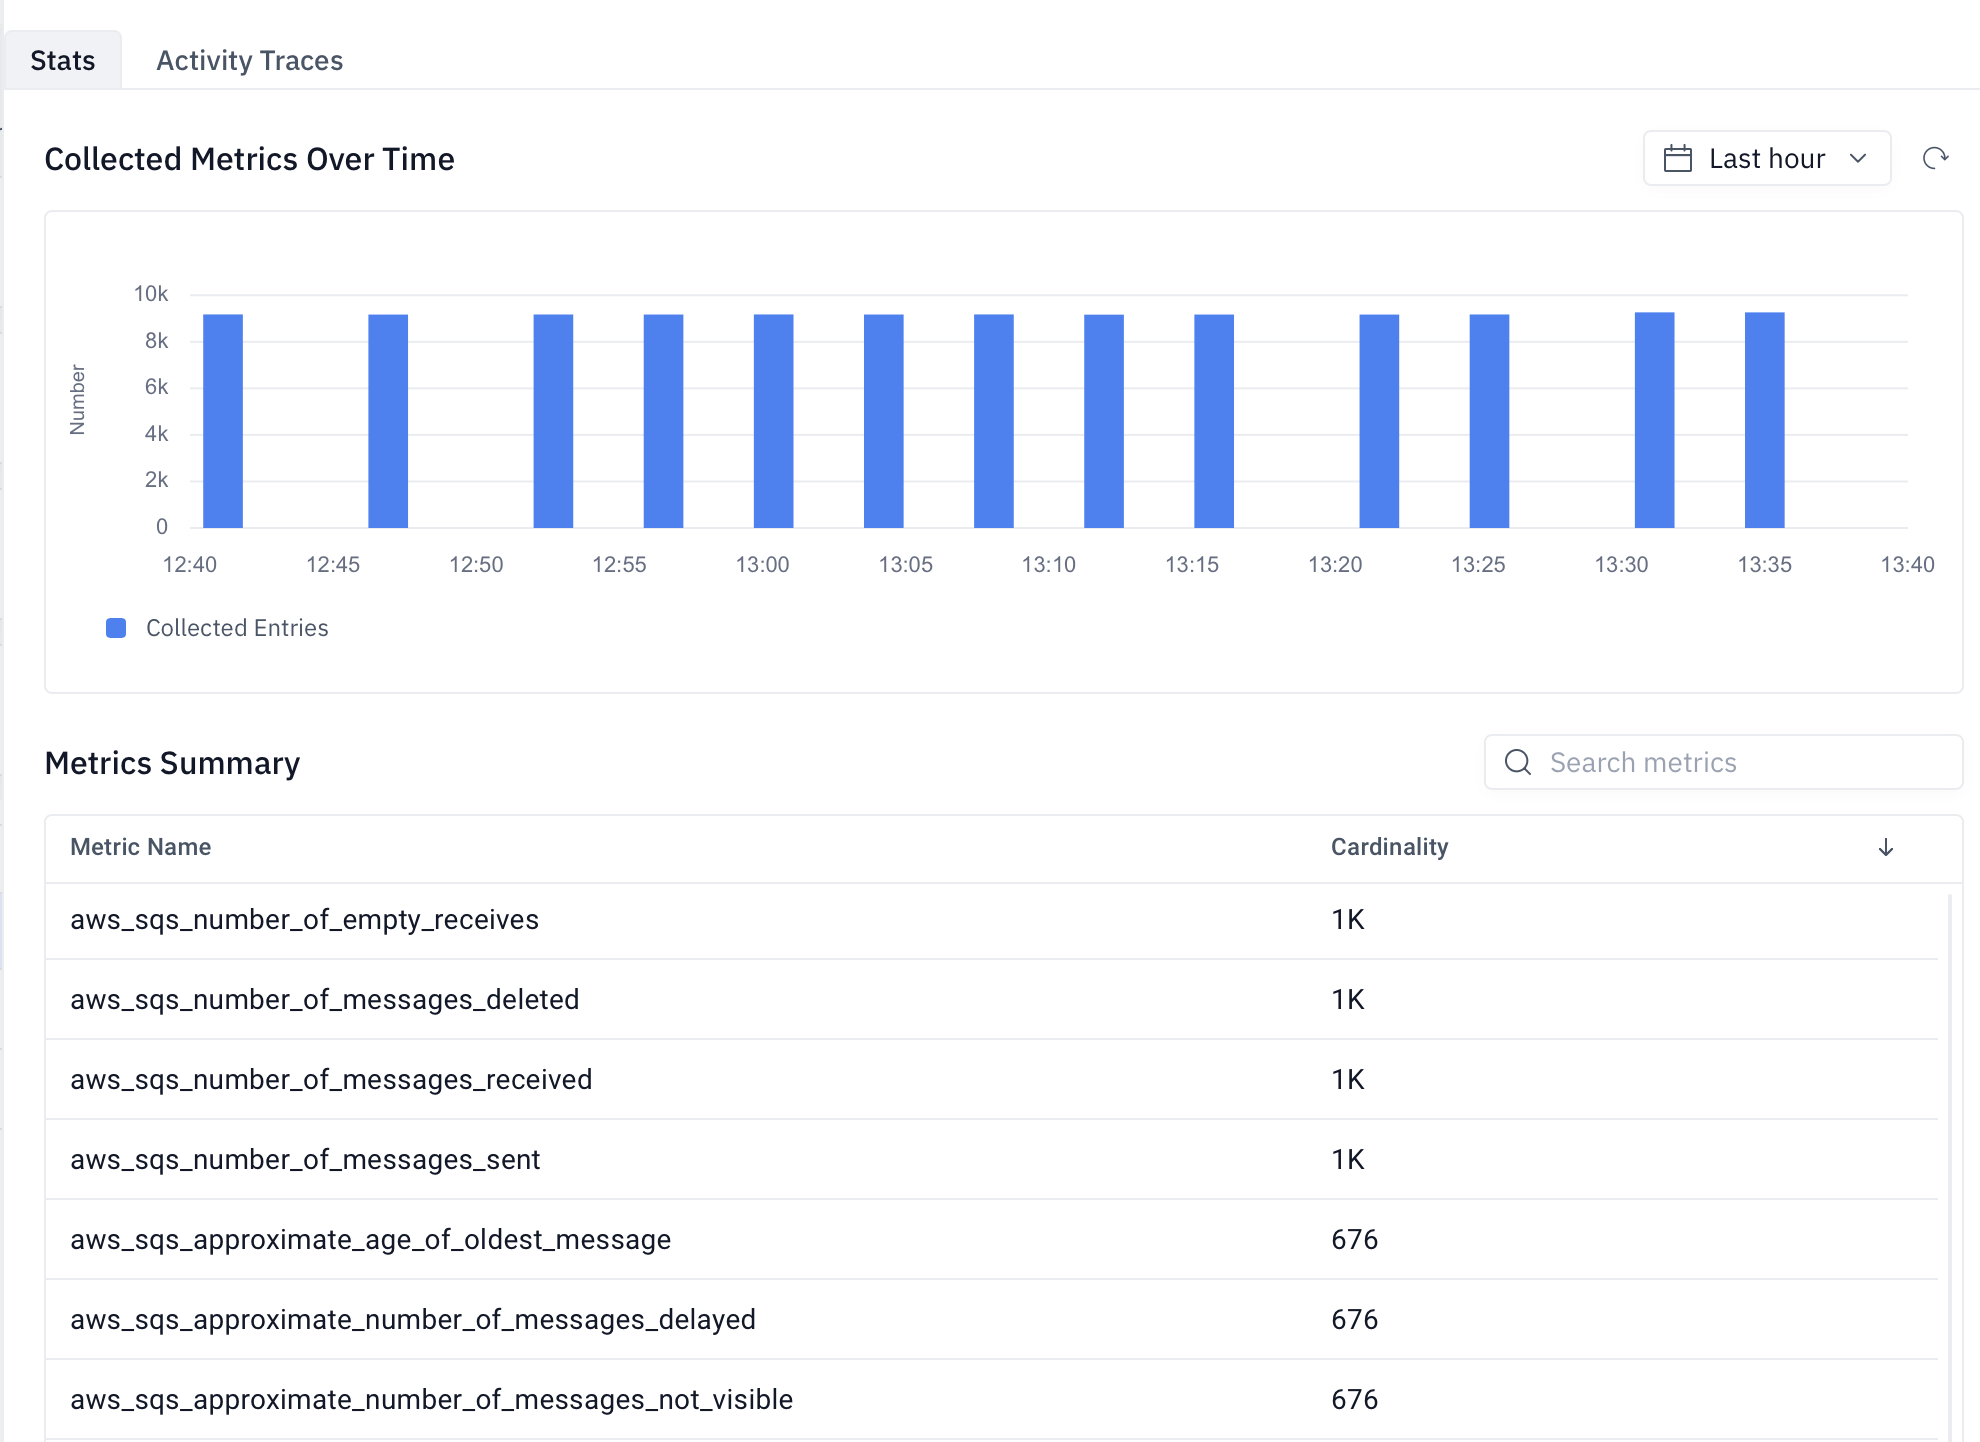
1. **Stats** - The number of metrics pulled and which metrics are pulled.
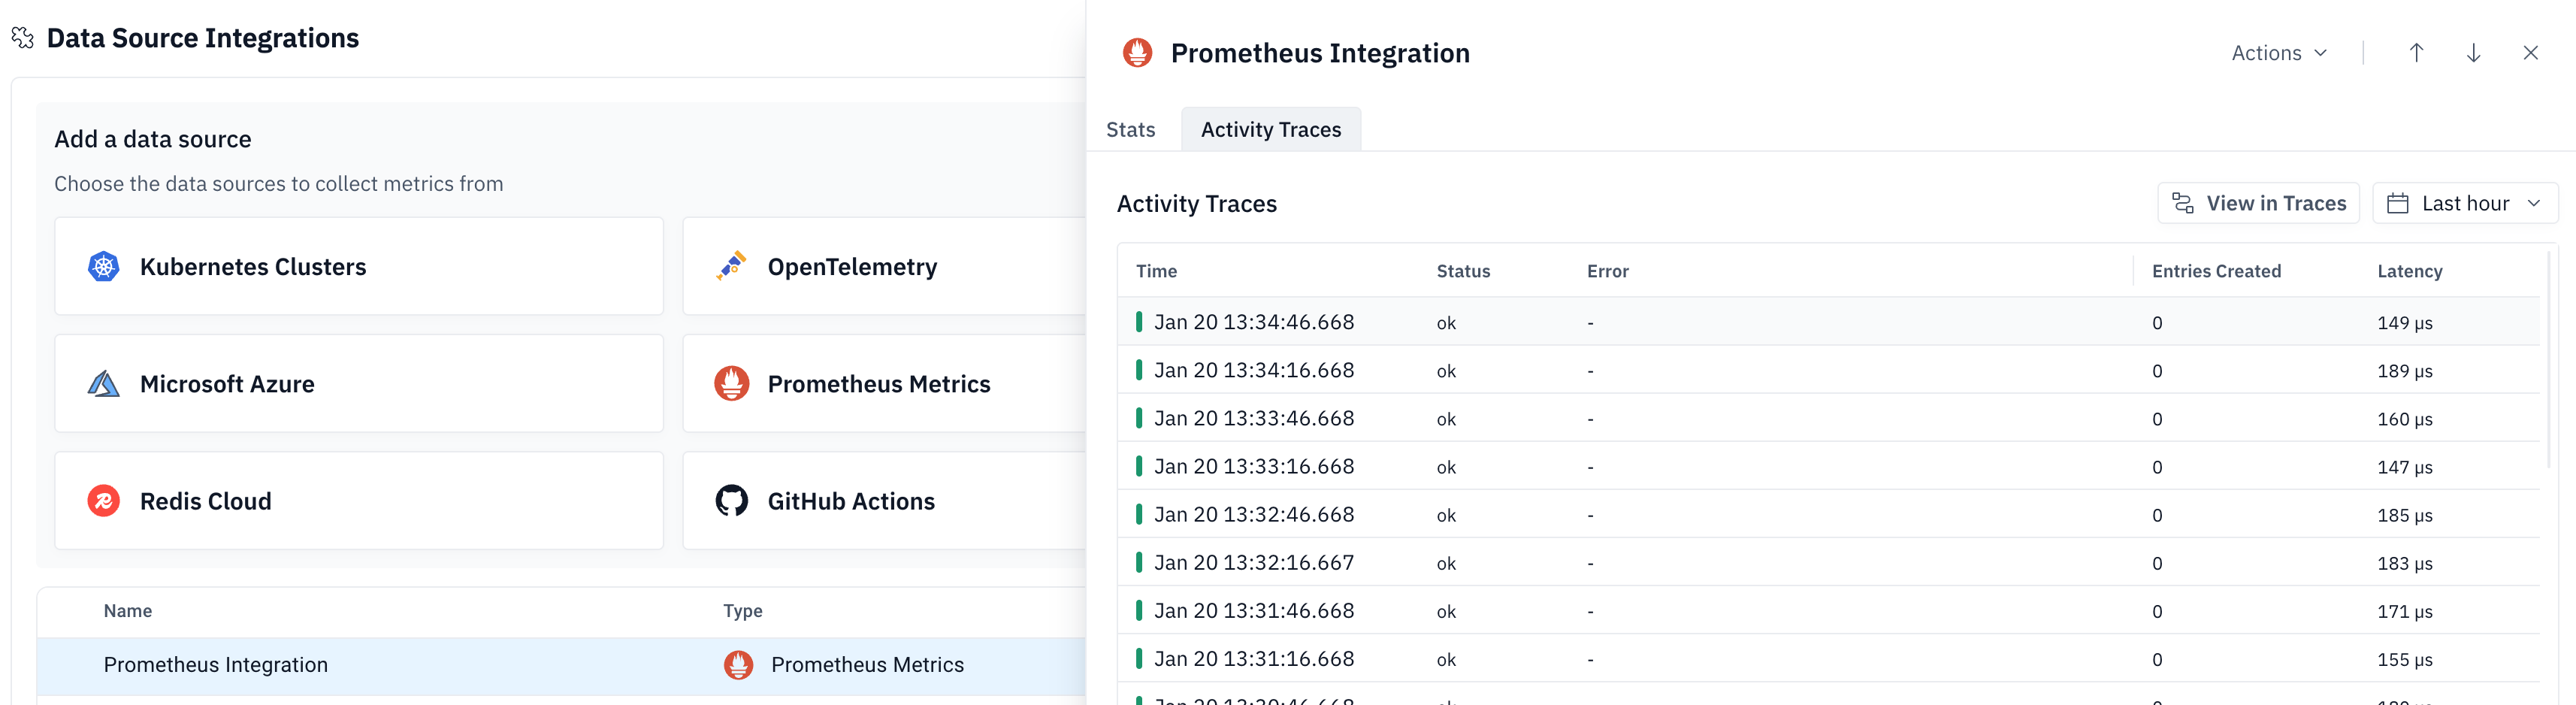
2. **Activity status** - the status of each attempt to collect data, such as authentication failure.
### Stats
This information is available in the Stats tab.
The top chart shows a bar for every collection run and indicates the number of entries collected in a specific run.
The bottom table details the specific metrics that were collected and their level of cardinality.
Users can change the time frame in order to see changes over time and see metrics which are collected in lower frequency.
Additional option is to navigate to the [Data Explorer](https://app.groundcover.com/explore/data-explorer) page, focus on a specific metric and apply a filter by `gc_integration_name` to see trends related to that metric.
### Activity Traces
Open the drawer and navigate to the Activity Traces tab to see the list of traces. Each row represent a single run to collect data.
You can also find collection attempts in [Traces](https://app.groundcover.com/traces). Replace the integration name in this filter:
```
source:groundcover-platform gc_integration_name:""
```
### Database monitoring diagnostics
[PostgreSQL](https://docs.groundcover.com/collect-data/data-sources/postgresql-database-monitoring.md) and [ClickHouse](https://docs.groundcover.com/collect-data/data-sources/clickhouse-database-monitoring.md) expose several independent outputs: health metrics, statement measurements, collected query traces, and Activity Traces. Activity Traces explain the collector's work; they are not the application's database queries. Verify each enabled output separately.
[MySQL Database Monitoring](https://docs.groundcover.com/collect-data/data-sources/mysql-database-monitoring.md) collects health metrics and statement measurements with Activity Traces for diagnostics. It does not export individual query traces. Its `groundcover_db_mysql_up` metric reports connection-check success, not complete collection coverage.
Open a collection attempt and expand its child spans. Health-query spans identify their group and query. A `statements` child describes measurement collection. PostgreSQL table/index collection also has a `database discovery` span and a `database` span for each attempted database, with query spans beneath it.
| Field | How to use it |
| -------------------------------------------------------- | -------------------------------------------------------------------------------------------------------------------------------------------------------------- |
| `integration.capability` | Identifies the health group or statements capability. The parent can list multiple capabilities in `integration.capabilities`. |
| `integration.query.name` | Identifies the specific collector query, where supplied. Several queries can belong to one group. |
| `integration.query.execution` | `executed` means the query ran, not that it succeeded; `skipped` means it did not run. |
| `integration.query.reason` | Explains a skip, partial availability, applied limit, or failure. Read the exception event for the underlying failure. |
| `server.address`, `server.port`, `db.namespace` | Locate the endpoint and, on PostgreSQL database/query spans, the affected database. |
| `job.total_entries_created` | Entry count reported by the span. Interpret it with span status and export errors; some statement spans report the prepared batch size before export succeeds. |
| `statements.exported_count` | PostgreSQL measurements successfully handed to the export path; zero is expected when seeding a baseline. |
| `statements.snapshot_rows` / `statements.events` | PostgreSQL snapshot size / ClickHouse event count considered by the measurement collector. These are not execution totals. |
| `statements.window_start_us`, `statements.window_end_us` | Collection-window boundaries as Unix microseconds. |
| `statements.retry` | A pending measurement batch is being retried after an export failure. |
Not every field is present on every span. Integration name/type can be on the parent; inspect the whole trace. Diagnostic events can summarize multiple query names/reasons as lists.
#### Success, skips, warnings, and failures
* **Success with zero entries:** a query may have no applicable rows, or PostgreSQL measurements may be establishing a baseline. Inspect the reason and source data before changing permissions.
* **Skipped query:** a ` (skipped)` event records a selection decision, such as a disabled group, unsuitable primary/standby role, missing capability, or failed prerequisite. Skipping does not by itself mark the span as an error.
* **PostgreSQL availability warning:** a ` (unavailable)` event on the query and parent scrape spans records a known restriction encountered during execution. It includes `severity_text = WARN` and the original database error in `integration.query.reason`. The query span remains `Unset`, and the warning does not fail the scrape. Supported queries continue collecting; the affected query is attempted again on the next scrape. See [Aurora PostgreSQL limitations](https://docs.groundcover.com/collect-data/data-sources/postgresql-database-monitoring.md#aurora-postgresql-limitations).
* **Permission warning:** ClickHouse checks recommended broad grants on the connected server. `missing_permissions` means the recommended grant was not found; `check_unavailable` means the check could not complete. Collection continues, and narrower grants may suffice. Inspect `integration.permission.scope`, `integration.permission.checked_at`, `integration.permission.missing`, `integration.permission.unavailable`, and `integration.permission.remediation`. These checks do not verify every remote node.
* **Error span:** inspect the exception event and affected child query/database. Connection, query, conversion, and export failures require different fixes. Other queries, databases, or replicas may still export data; an error on the parent does not imply that the whole scrape was discarded.
* **Exception event on a successful span:** some row-level failures, such as ClickHouse statement fingerprinting, skip an individual event while collection continues. Read events as well as the status.
#### Diagnose a failed or incomplete collection
| Symptom | Check and remediation |
| ------------------------------------------------- | ----------------------------------------------------------------------------------------------------------------------------------------------------------------------------------------------------------------------------------------------- |
| Connection, DNS, authentication, or TLS error | Verify the configured endpoint, protocol, secret reference, and certificate trust from the actual execution location: backend or selected monitored cluster. |
| Permission denied | Run the failing source query as the integration user. Apply the documented database/system-table grants to the intended scope. For PostgreSQL, check usable role inheritance and CONNECT; for ClickHouse cluster mode, also check remote users. |
| Query timeout | Inspect the query/database that timed out and database load. Reduce selected groups, relation top-N, or include lists when applicable; adjust query timeout only after confirming that work can complete within the collection cadence. |
| Export failure / statements.retry | Collection reached the export stage. Inspect the exception and integrations-agent logs for the delivery failure; verify connectivity to ingestion. A retry does not require a database grant change. |
| Some metrics missing despite a successful scrape | Check group enablement, exclusions, source capability, NULL/unavailable values, top-N selection, and empty sources. Compare with the engine's metric reference. |
| Measurements missing despite visible query traces | Verify measurement enablement, user/INSERT filters, and measurement windows. PostgreSQL needs a baseline plus another active interval; ClickHouse needs recent initial-query terminal events. Query traces are a separate output. |
After fixing the cause, allow another collection attempt, inspect its child spans, and query the actual metrics or [statement measurements](https://docs.groundcover.com/reference/remote-access-and-apis/api-examples/query-database-measurements.md). A successful export-path call is not a substitute for verifying that data can be queried.
The product does not expose a persisted per-group coverage/status view. Use recent Activity Traces alongside collected data. For exact engine-specific events, SQL checks, and fixes, see [PostgreSQL troubleshooting](https://docs.groundcover.com/collect-data/data-sources/postgresql-database-monitoring.md#troubleshooting), [ClickHouse troubleshooting](https://docs.groundcover.com/collect-data/data-sources/clickhouse-database-monitoring.md#troubleshooting), and [MySQL troubleshooting](https://docs.groundcover.com/collect-data/data-sources/mysql-database-monitoring.md#troubleshooting). For MySQL, inspect root, capability, and query events: known health-query restrictions can leave a query span Unset with warnings while its capability succeeds. Permission-probe events can include `integration.permission.remediation` with an account-specific grant.
## Push Integrations
In the case of push integrations, users should check the source for any issues sending data. Within groundcover, any label that was added to incoming Telemetry can be used to filter accordingly and ensure the right data is sent.
---
# Agent Instructions
This documentation is published with GitBook. GitBook is the documentation platform designed so that both humans and AI agents can read, navigate, and reason over technical content effectively. Learn more at gitbook.com.
## Querying This Documentation
If you need additional information that is not directly available in this page, you can query the documentation by asking a question.
Perform an HTTP GET request on the following URL with the `ask` and `goal` query parameters:
```
GET https://docs.groundcover.com/collect-data/monitor-data-sources-integrations.md?ask=&goal=
```
`ask` is the immediate question: it should be specific, self-contained, and written in natural language.
`goal` is what the user is ultimately trying to achieve, the reason they need the answer. Sharing it helps GitBook give you a better, more relevant answer. A goal is most helpful when it describes the outcome the user wants rather than restating the question. For example, with `ask=how do I create an API token`, a goal like `automate deployments from our CI pipeline` lets GitBook tailor the answer to that use case.
The response will contain a direct answer to the question and relevant excerpts and sources from the documentation.
Use this mechanism when the answer is not explicitly present in the current page, you need clarification or additional context, or you want to retrieve related documentation sections.