> For the complete documentation index, see [llms.txt](https://docs.groundcover.com/llms.txt). Markdown versions of documentation pages are available by appending `.md` to page URLs; this page is available as [Markdown](https://docs.groundcover.com/automate/monitors/notification-routes.md).
# Notification Routes
Notification Routes let you automatically send notifications to Destinations when monitor issues change state.
{% hint style="info" %}
This capability is only available to BYOC deployments. Check out our [pricing page](https://www.groundcover.com/pricing) for more information about subscription plans and the available deployment modes.
{% endhint %}
{% hint style="info" %}
Editor permissions are required for creating and editing Notification Routes.\
Reader permissions may list the existing Notification Routes.
{% endhint %}
### How It Works
1. **Scope**: A gcQL query that filters which monitors' issues will trigger this route
2. **Rules**: Define what happens when an issue is in a specific state (Firing or Resolved)
3. [**Destinations**](/automate/connected-apps.md): Choose where to send the notification (e.g., Slack Webhook, PagerDuty, etc)
### Prerequisites
Before creating notification routes, set up your Destinations in **Integrations → Destinations**.
### Create a Notification Route
1. Go to **Monitors → Notification Routes**
2. Click **Create Notification Route**
3. Complete the wizard:
#### Step 1: Route Name
Give your route a descriptive name (e.g., `prod-critical-alerts`, `infra-team-notifications`).
#### Step 2: Scope Monitors
Define which monitors this route applies to using gcQL on:
1. The grouping labels defined in the query
2. The custom labels
3. The Monitor's metadata such as the name or severity
**Examples:**
* `env:prod` — All monitors with grouping key 'env' and possible value of 'prod'
* `env:prod AND severity:S1` — Only critical production alerts
* `team:platform` — Monitors with a custom label for the platform team
* `*:*` — To match all monitors
#### Step 3: Rules
Rules define what happens when a scoped monitor's issue changes state.
Each rule has:
* **Status**: When to trigger — `Firing` (issue is active) or `Resolved` (issue cleared)
* **Destinations**: Where to send the notification
**Example setup:**
* When **Firing or Resolved** → Send to `#prod-alerts` Slack channel
* When **Firing or Resolved** → Create and synchronize a [Linear issue](/automate/connectors/linear.md#automate-linear-issues-with-a-notification-route)
* When **Firing** (only) → Send to `Pagerduty` service directory
Click **Add Rule** to create multiple rules with different status/destination combinations.
**Selecting Slack App channels**
When you add a [Slack App](/automate/connected-apps.md) Destination to a rule, the destination dropdown opens a drilldown so you can pick the exact channel to deliver to:
1. Click the destination dropdown on the rule.
2. Select your Slack App from the list — it is marked with an **App** tag.
3. A second panel opens listing the channels in the workspace. Use the search box to filter by name.
4. Click the target channel. With the default permissions, the bot can post to public channels without being added. Private channels show a lock icon and only appear in the picker if the bot has been invited to them.
5. To deliver to additional channels (on the same Slack App or a different Destination), click **+** on the rule and repeat.
{% hint style="info" %}
You can route the same monitor to multiple Slack channels by adding the Slack App once per channel in the same rule, or by creating multiple rules.
{% endhint %}
To set up the Slack App connector itself, see [Slack](/automate/connectors/slack.md).
{% hint style="info" %}
If you reduce Slack app permissions, channel delivery requirements can change. See [Slack App Permissions Reference](/automate/connectors/slack.md#slack-app-permissions-reference).
{% endhint %}
#### Re-notification Interval
Configure how long to wait before sending another notification while an alert is still firing.
Options: 1m, 5m, 10m, 30m, 1h, 2h, 4h, 8h, 12h, 1d, 2d
This prevents notification fatigue from long-running alerts.
### Managing Notification Routes
The Notification Routes page shows all your routes with:
* **Name**: Route identifier
* **Scope**: The gcQL query defining which monitors are affected
* **Destinations**: Summary of destinations by type
* **Creator**: Who created the route
#### Edit, Duplicate, or Delete
Hover over any row to access the action menu:
* **Edit**: Modify the route configuration
* **Duplicate**: Create a copy as a starting point
* **Delete**: Remove the route
### Example Use Cases
#### Route Critical Production Alerts to PagerDuty and Slack
```
Name: prod-critical-pagerduty
Scope: env:prod AND severity:S1
Rules:
- When Firing → PagerDuty On-Call
- When Firing or Resolved → #critical-alerts (Slack)
```
#### Separate Routes by Team
```
Name: platform-team-alerts
Scope: team:platform
Rules:
- When Firing → #platform-alerts (Slack)
- When Resolved → #platform-alerts (Slack)
```
```
Name: backend-team-alerts
Scope: team:backend
Rules:
- When Firing → #backend-alerts (Slack)
- When Resolved → #backend-alerts (Slack)
```
#### Development Alerts — Firing Only
```
Name: dev-notifications
Scope: env:dev
Rules:
- When Firing → #dev-alerts (Slack)
```
### Alerting on No Data
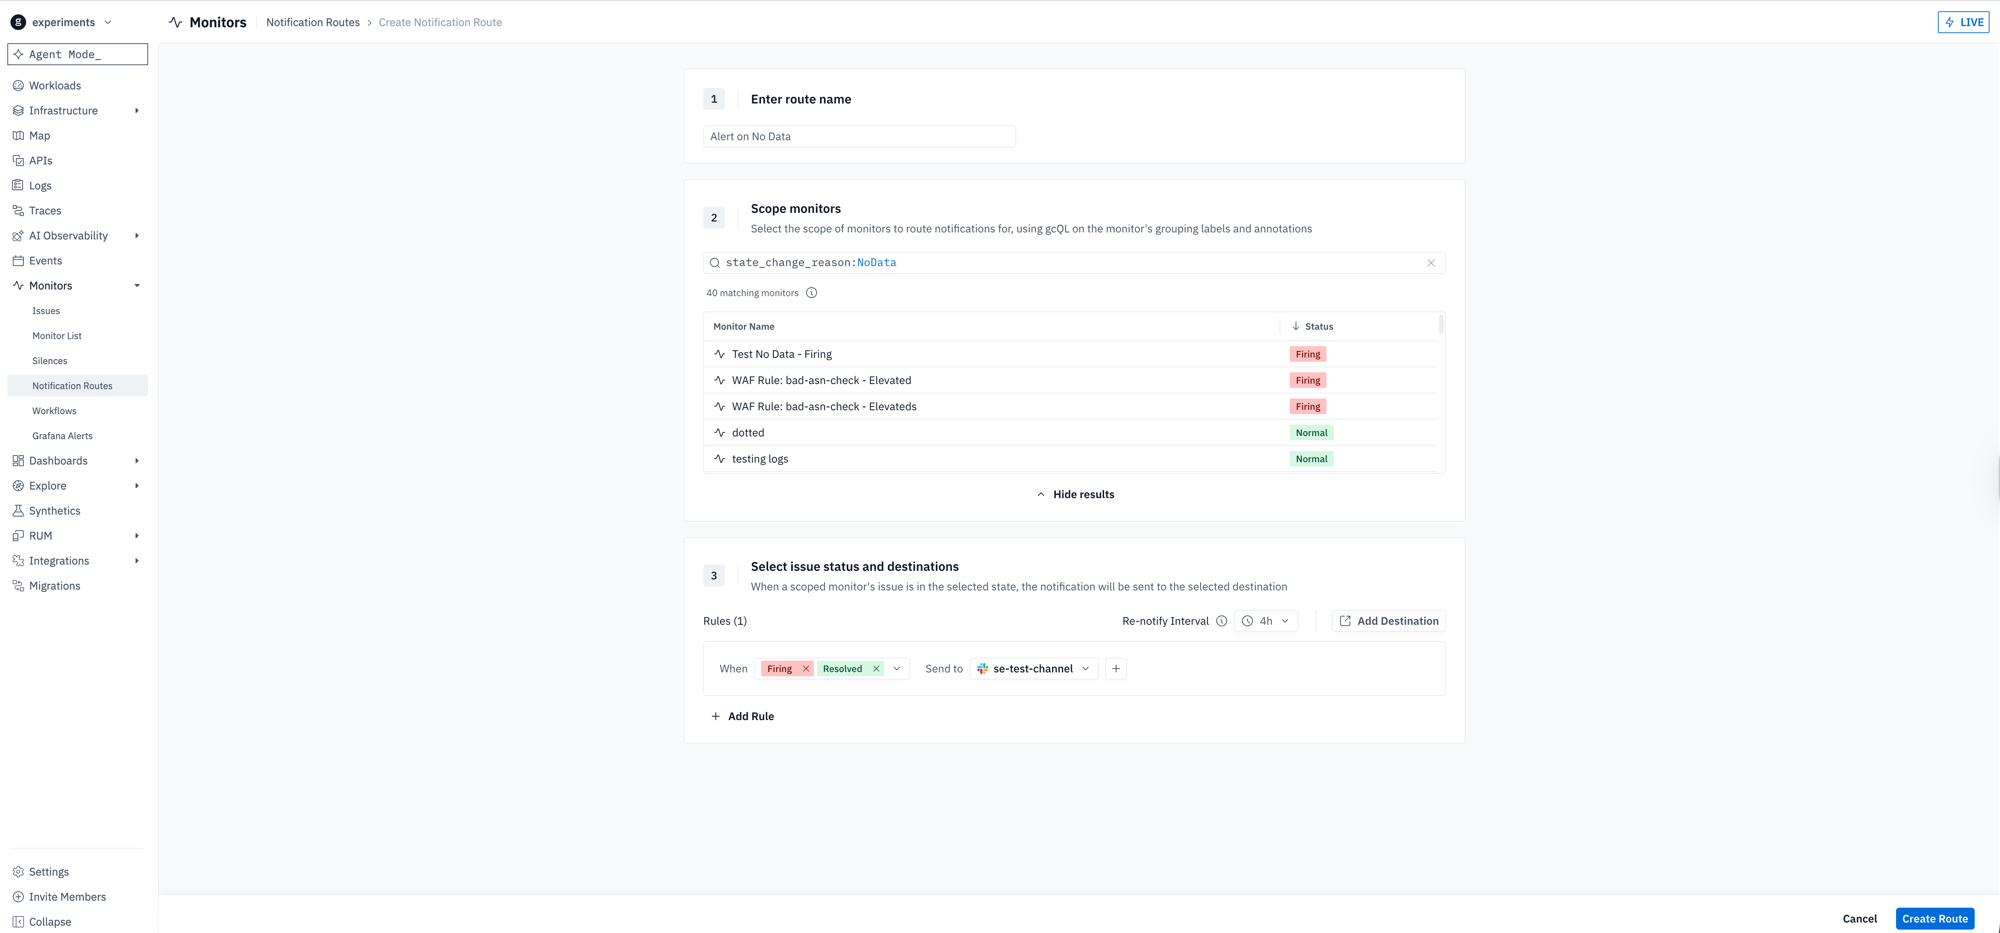
Notification routes match **Issues** — so to alert on no data, the monitor first has to **create an Issue** when it returns no data. The **No Data** status on its own is not an Issue and produces no notification, so there is nothing for a route to match. To be notified, set the monitor to **Treat No Data As → Firing** (which turns a no-data evaluation into an Issue), then scope a route to those Issues:
#### Step 1: Set the monitor to treat No Data as Firing
In the monitor wizard, set **Treat No Data As → Firing** (or `noDataState: Alerting` in YAML). An evaluation that returns no data then creates an Issue, just like a threshold breach.
{% hint style="info" %}
A query returns "no data" only when it produces **no rows**, not when it returns a row whose value is `0`. To turn an empty result into No Data, filter out the zero row — e.g. `... | stats count() as cnt | filter cnt > 0`. See [No data vs. a zero value](/automate/monitors/create-a-new-monitor.md).
{% endhint %}
#### Step 2: Scope a notification route to the No Data reason
Create a notification route and, in **Step 2: Scope Monitors**, use the gcQL condition:
```gcql
state_change_reason:NoData
```
This matches only the Issues that were created because the monitor returned no data. Combine it with any other condition as needed, e.g. `state_change_reason:NoData AND severity:S1`. Then add a rule and destination in **Step 3** (e.g. *When Firing → #my-alerts*).
A notification route that alerts on No Data, scoped with state_change_reason:NoData
### Testing Notifications
To test your notification configuration before enabling it on production monitors:
1. **Test Destinations directly**: In **Integrations → Destinations**, click the "Test" button on any configured destination to send a test notification with sample data
2. **Test from a monitor**: Open any monitor, click the "Test" button to send a test notification using that monitor's actual payload
{% hint style="info" %}
The test button in Destinations requires Admin permissions. The test button within monitors works for Editor permissions and respects your RBAC data scope.
{% endhint %}
### Re-notification Behavior
Understanding how re-notification intervals work:
* The re-notification timer starts when the first notification is sent
* If an alert **resolves and fires again** within the re-notification window, and the fingerprint is the same, the timer continues (no new notification)
* The `renotification_count` field in payloads starts at 0 for the first notification and increments with each re-notification
* When an alert resolves, the counter resets for the next firing cycle
### Permissions
| Action | Required Permission |
| ------------------------------- | ------------------- |
| Create/Edit Notification Routes | Editor |
| View Notification Routes | Reader |
| Create/Edit Destinations | Admin |
| Test Destinations | Admin |
| Test from Monitor | Editor |
### How Routes Apply to Monitors
Notification Routes apply **automatically** based on label matching. You do not need to edit existing monitors to use routes:
1. Routes match monitors based on the scope query (gcQL)
2. When a monitor fires, all routes whose scope matches the monitor's labels will trigger
3. Multiple routes can match the same monitor
### Troubleshooting
#### Notifications not being sent
1. Verify the scope query matches your monitor's labels
2. Check that the Destination is properly configured (use Test button)
3. Review notification delivery traces in groundcover for delivery errors
4. Ensure the monitor has transitioned state (not just hovering at threshold)
#### Wrong time range in issue links
If clicking notification links shows "Last 5 minutes" instead of the actual alert time, this typically affects legacy Workflow-based notifications. Migrate to Notification Routes for proper time range handling.
#### Debugging notification delivery
Notification delivery is performed by the `dispatch-center` service, which emits OpenTelemetry traces for every signal it processes. To inspect delivery attempts and errors, filter traces in groundcover by the route's identifier:
* `route.id` — exact match on the notification route's UUID
* `route.name` — match by the route's display name
Useful span names include `dispatch.signal` (one per signal evaluation) and `dispatch.scan` (per scan iteration). For Slack App deliveries specifically, the `slack.channels` attribute lists the channel IDs the message was sent to.
---
# Agent Instructions
This documentation is published with GitBook. GitBook is the documentation platform designed so that both humans and AI agents can read, navigate, and reason over technical content effectively. Learn more at gitbook.com.
## Querying This Documentation
If you need additional information that is not directly available in this page, you can query the documentation by asking a question.
Perform an HTTP GET request on the following URL with the `ask` and `goal` query parameters:
```
GET https://docs.groundcover.com/automate/monitors/notification-routes.md?ask=&goal=
```
`ask` is the immediate question: it should be specific, self-contained, and written in natural language.
`goal` is what the user is ultimately trying to achieve, the reason they need the answer. Sharing it helps GitBook give you a better, more relevant answer. A goal is most helpful when it describes the outcome the user wants rather than restating the question. For example, with `ask=how do I create an API token`, a goal like `automate deployments from our CI pipeline` lets GitBook tailor the answer to that use case.
The response will contain a direct answer to the question and relevant excerpts and sources from the documentation.
Use this mechanism when the answer is not explicitly present in the current page, you need clarification or additional context, or you want to retrieve related documentation sections.