LogoLogo
Log in|Playground
  • Welcome
    • Introduction
    • FAQ
  • Capabilities
    • Log Management
    • Infrastructure Monitoring
    • Application Performance Monitoring (APM)
      • Application Metrics
      • Traces
      • Supported Technologies
    • Real User Monitoring (RUM)
  • Getting Started
    • Requirements
      • Kubernetes requirements
      • Kernel requirements for eBPF sensor
      • CPU architectures
      • ClickHouse resources
    • Installation & updating
    • Connect Linux hosts
    • Connect RUM
    • 5 quick steps to get you started
    • groundcover MCP
  • Use groundcover
    • Monitors
      • Create a new Monitor
      • Issues page
      • Monitor List page
      • Silences page
      • Monitor Catalog page
      • Monitor YAML structure
      • Embedded Grafana Alerts
        • Create a Grafana alert
    • Dashboards
      • Create a dashboard
      • Embedded Grafana Dashboards
        • Create a Grafana dashboard
        • Build alerts & dashboards with Grafana Terraform provider
        • Using groundcover datasources in a Self-hosted Grafana
    • Insights
    • Explore & Monitors query builder
    • Workflows
      • Create a new Workflow
      • Workflow Examples
      • Alert Structure
    • Search & Filter
    • Issues
    • Role-Based Access Control (RBAC)
    • Service Accounts
    • API Keys
    • APIs
    • Log Patterns
    • Drilldown
    • Scraping custom metrics
      • Operator based metrics
      • kube-state-metrics
      • cadvisor metrics
    • Backup & Restore Metrics
    • Metrics & Labels
    • Add custom environment labels
    • Configuring Pipelines
      • Writing Remap Transforms
      • Logs Pipeline Examples
      • Traces Pipeline Examples
      • Logs to Events Pipeline Examples
      • Logs/Traces Sensitive Data Obfuscation
      • Sensitive Data Obfuscation using OTTL
      • Log Filtering using OTTL
    • Querying your groundcover data
      • Query your logs
        • Example queries
        • Logs alerting
      • Query your metrics
      • Querying you data using an API
      • Using KEDA autoscaler with groundcover
  • Log Parsing with OpenTelemetry Pipelines
  • Log and Trace Correlation
  • RUM
  • Customization
    • Customize deployment
      • Agents in host network mode
      • API Key Secret
      • Argo CD
      • On-premise deployment
      • Quay.io registry
      • Configuring sensor deployment coverage
      • Enabling SSL Tracing in Java Applications
    • Customize usage
      • Filtering Kubernetes entities
      • Custom data retention
      • Sensitive data obfuscation
      • Custom storage
      • Custom logs collection
      • Custom labels and annotations
        • Enrich logs and traces with pod labels & annotations
        • Enrich metrics with node labels
      • Disable tracing for specific protocols
      • Tuning resources
      • Controlling the eBPF sampling mechanism
  • Integrations
    • Overview
    • Workflow Integrations
      • Slack Webhook Integration
      • Opsgenie Integration
      • Webhook Integration
        • Incident.io
      • PagerDuty Integration
      • Jira Webhook Integration
    • Data sources
      • OpenTelemetry
        • Traces & Logs
        • Metrics
      • Istio
      • AWS
        • Ingest CloudWatch Metrics
        • Ingest CloudWatch Logs
        • Ingest Logs Stored on S3
        • Integrate CloudWatch Grafana Datasource
      • GCP
        • Ingest Google Cloud Monitoring Metrics
        • Stream Logs using Pub/Sub
        • Integrate Google Cloud Monitoring Grafana Datasource
      • Azure
        • Ingest Azure Monitor Metrics
      • DataDog
        • Traces
        • Metrics
      • FluentBit
      • Fluentd
      • JSON Logs
    • 3rd-party metrics
      • ActiveMQ
      • Aerospike
      • Cassandra
      • CloudFlare
      • Consul
      • CoreDNS
      • Etcd
      • HAProxy
      • Harbor
      • JMeter
      • K6
      • Loki
      • Nginx
      • Pi-hole
      • Postfix
      • RabbitMQ
      • Redpanda
      • SNMP
      • Solr
      • Tomcat
      • Traefik
      • Varnish
      • Vertica
      • Zabbix
    • Source control (Gitlab/Github)
  • Architecture
    • Overview
    • inCloud Managed
      • Setup inCloud Managed with AWS
        • AWS PrivateLink Setup
        • EKS add-on
      • Setup inCloud Managed with GCP
      • Setup inCloud Managed with Azure
      • High Availability
      • Disaster Recovery
      • Ingestion Endpoints
      • Deploying in Sensor-Only mode
    • Security considerations
      • Okta SSO - onboarding
    • Service endpoints inside the cluster
  • Product Updates
    • What's new?
    • Earlier updates
      • 2025
        • Mar 2025
        • Feb 2025
        • Jan 2025
      • 2024
        • Dec 2024
        • Nov 2024
        • Oct 2024
        • Sep 2024
        • Aug 2024
        • July 2024
        • May 2024
        • Apr 2024
        • Mar 2024
        • Feb 2024
        • Jan 2024
      • 2023
        • Dec 2023
        • Nov 2023
        • Oct 2023
Powered by GitBook
On this page
  • Overview
  • Collection
  • Configuration
  • Enrichment
  • Infrastructure Metrics
  • Container CPU and Memory
  • Node CPU, Memory and Disk
  • PVC Usage
  • Network Usage
Export as PDF
  1. Capabilities

Infrastructure Monitoring

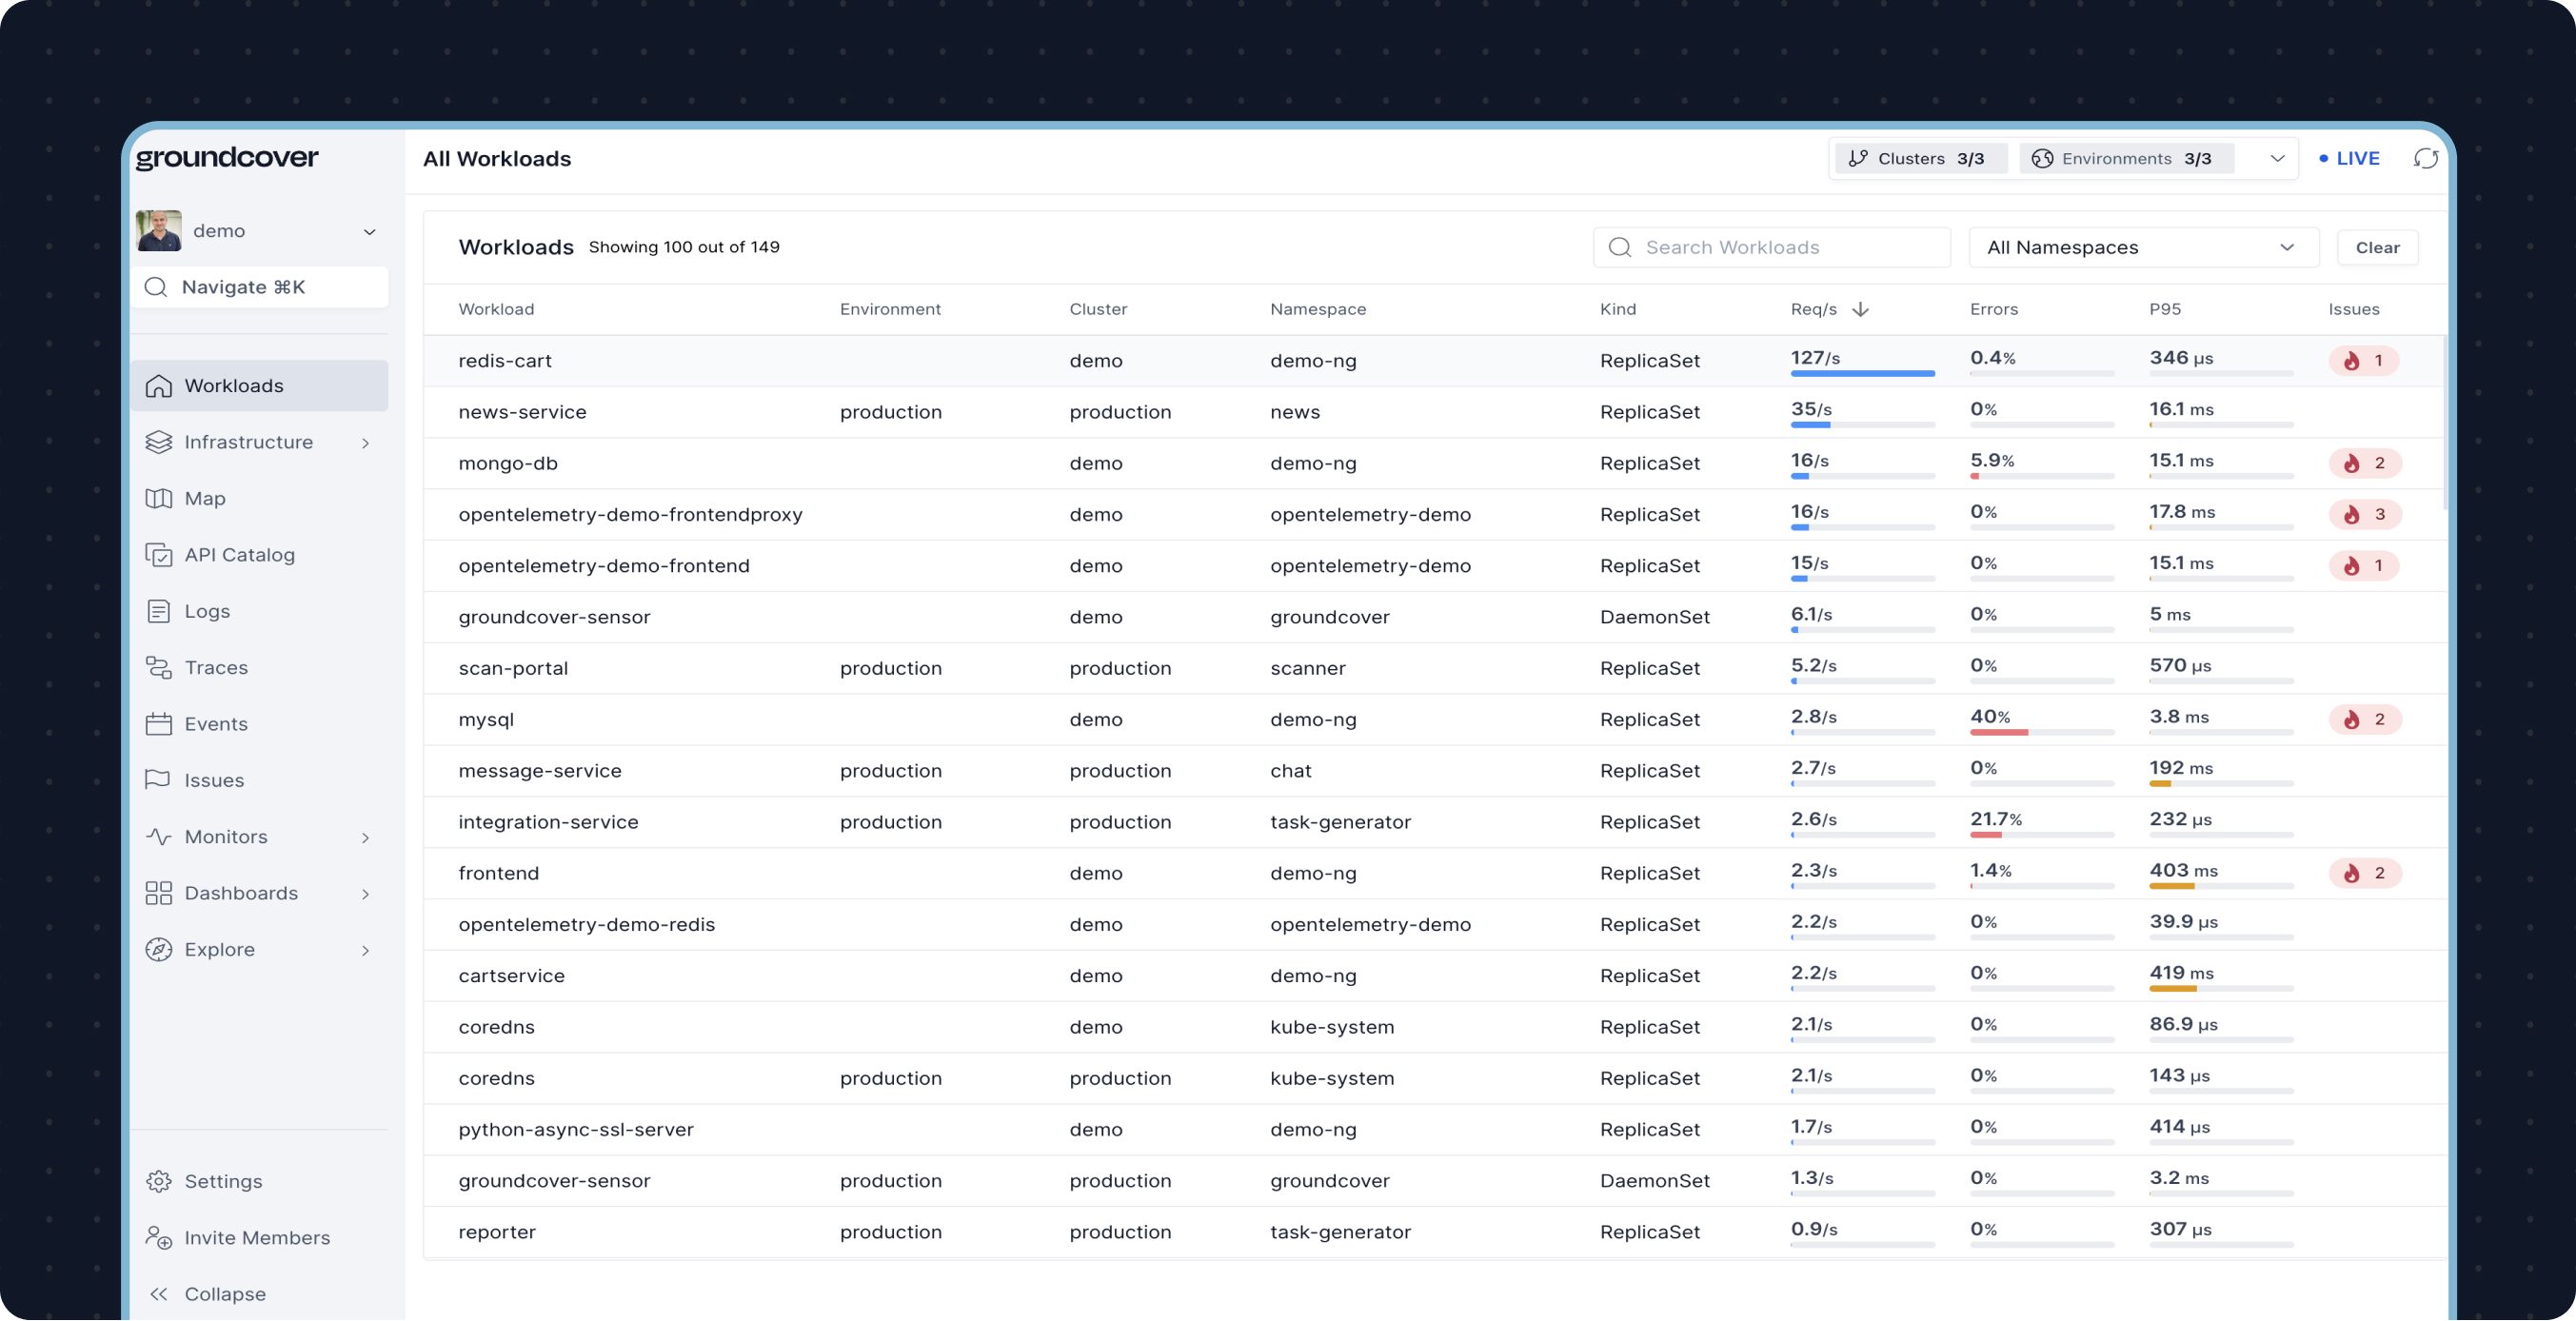
Get complete visibility into your cloud infrastructure performance at any scale, easily access all your metrics in one place and optimize infrastructure efficiency.

Last updated 2 months ago

Overview

The groundcover platform offers infrastructure monitoring capabilities that were built for cloud-native environments. It enables you to track the
health and efficiency of your infrastructure instantly, with an effortless deployment process.

Troubleshoot efficiently - acting as a centralized hub for all your infrastructure, application and customer metrics allows you to query, correlate and troubleshoot your cloud environments using real time data and insight on your entire stack.

Store it all, without a sweat - store any metrics volume without worrying about cardinality or retention limits. remain unaffected by the granularity of metrics you store or query.

Collection

groundcover's proprietary eBPF sensor leverages all its innovative powers to collect comprehensive data across your cloud environments without the burden of performance overhead. This data is sourced from various Kubernetes components, including kube-system workloads, cluster information via the Kubernetes API, and the applications' interactions with the Kubernetes infrastructure. This level of detailed collection at the kernel level enables the ability to provide actionable insights into the health of your Kubernetes clusters, which are indispensable for troubleshooting existing issues and taking proactive steps to future-proof your cloud environments.

Configuration

You also have the option to for your metrics in the VictoriaMetrics database. By default, logs are retained for 7 days, but you can adjust this period to your preferences.

Enrichment

Beyond collecting data, groundcover's methodology involves a strategic layer of data enrichment that seeks to correlate Kubernetes metrics with application performance indicators. This correlation is crucial for creating a transparent image of the Kubernetes ecosystem. It enables a deep understanding of how Kubernetes interacts with applications, identifying across the interconnected environment. By monitoring Kubernetes not as an isolated platform but as an integral part of the application infrastructure, groundcover ensures that the monitoring strategy aligns with your dynamic and complex cloud operations.

Infrastructure Metrics

Monitoring a cluster involves tracking resources that are critical to the performance and stability of the entire system. Monitoring these essential metrics is crucial for maintaining a healthy Kubernetes cluster:

  • CPU consumption: It's essential to track the CPU resources being utilized against the total capacity to prevent workloads from failing due to insufficient CPU availability.

  • Memory utilization: Keeping an eye on the remaining memory resources ensures that your cluster doesn't encounter disruptions due to memory shortages.

  • Disk space allocation: For Kubernetes clusters running stateful applications or requiring persistent storage for data, such as etcd databases, tracking the available disk space is crucial to avert potential storage deficiencies.

  • Network usage: Visualize traffic rates and connections being established and closed on a service-to-service level of granularity, and easily pinpoint cross availability zone communication to investigate misconfigurations and surging costs.

Container CPU and Memory

Available Labels

type

clusterId region namespace node_name workload_name

pod_name container_name container_image

Available Metrics

Name
Description
Type

groundcover_container_cpu_usage_rate_millis

CPU usage in mCPU

Gauge

groundcover_container_cpu_request_m_cpu

K8s container CPU request (mCPU)

Gauge

groundcover_container_cpu_limit_m_cpu

K8s container CPU limit (mCPU)

Gauge

groundcover_container_memory_working_set_bytes

current memory working set (B)

Gauge

groundcover_container_memory_rss_bytes

current memory RSS (B)

Gauge

groundcover_container_memory_request_bytes

K8s container memory request (B)

Gauge

groundcover_container_memory_limit_bytes

K8s container memory limit (B)

Gauge

groundcover_container_cpu_delay_seconds

K8s container CPU delay accounting in seconds

Counter

groundcover_container_disk_delay_seconds

K8s container disk delay accounting in seconds

Counter

groundcover_container_cpu_throttled_seconds_total

K8s container total CPU throttling in seconds

Counter

Node CPU, Memory and Disk

Available Labels

type clusterId region node_name

Available Metrics

Name
Description
Type

groundcover_node_allocatable_cpum_cpu

amount of allocatable CPU in the current node (mCPU)

Gauge

groundcover_node_allocatable_mem_bytes

amount of allocatable memory in the current node (B)

Gauge

groundcover_node_mem_used_percent

percent of used memory in current node (0-100)

Gauge

groundcover_node_used_disk_space

current used disk space in current node (B)

Gauge

groundcover_node_free_disk_space

amount of free disk space in current node (B)

Gauge

groundcover_node_total_disk_space

amount of total disk space in current node (B)

Gauge

groundcover_node_used_percent_disk_space

percent of used disk space in current node (0-100)

Gauge

PVC Usage

Available Labels

type clusterId region name namespace

Available Metrics

Name
Description
Type

groundcover_pvc_usage_bytes

PVC used bytes (B)

Gauge

groundcover_pvc_capacity_bytes

PVC capacity bytes (B)

Gauge

groundcover_pvc_available_bytes

PVC available bytes (B)

Gauge

groundcover_pvc_usage_percent

percent of used pvc storage (0-100)

Gauge

Network Usage

Available Labels

clusterId workload_name namespace container_name remote_service_name remote_namespace remote_is_external availability_zone region remote_availability_zone remote_region is_cross_az protocol role server_port encryption transport_protocol is_loopback

Notes:

  • is_loopback and remote_is_external are special labels that indicate the remote service is either the same service as the recording side (loopback) or resides in an external network, e.g managed service outside of the cluster (external).

    • In both cases the remote_service_name and the remote_namespace labels will be empty

  • is_cross_az means the traffic was sent and/or received between two different availability zones. This is a helpful flag to quickly identify this special kind of communication.

    • The actual zones are detailed in the availability_zone and remote_availability_zone labels

Available Metrics

Name
Description
Type

groundcover_network_rx_bytes_total

Bytes received by the workload (B)

Counter

groundcover_network_tx_bytes_total

Bytes sent by the workload (B)

Counter

groundcover_network_connections_opened_total

Connections opened by the workload

Counter

groundcover_network_connections_closed_total

Connections closed by the workload

Counter

groundcover_network_connections_opened_failed_total

Connections attempts failed per workload (including refused connections)

Counter

groundcover_network_connections_opened_refused_total

Connections attempts refused per workload

Counter

Your subscription costs
define the retention period
potential points of failure